 ES
ES EN
ENAssisted Sales Reports: Measure the real impact of your campaigns
Reports are fundamental tools in the world of Digital Marketing. They are the compass that guides your decisions and future actions to achieve new results.
In this article we will explore in detail what Assisted Sales reports are, an effective means for you to measure what the billing of your Campaigns and Automations was and also what is the value of your average ticket. And much more!
How to view your reports in your account?
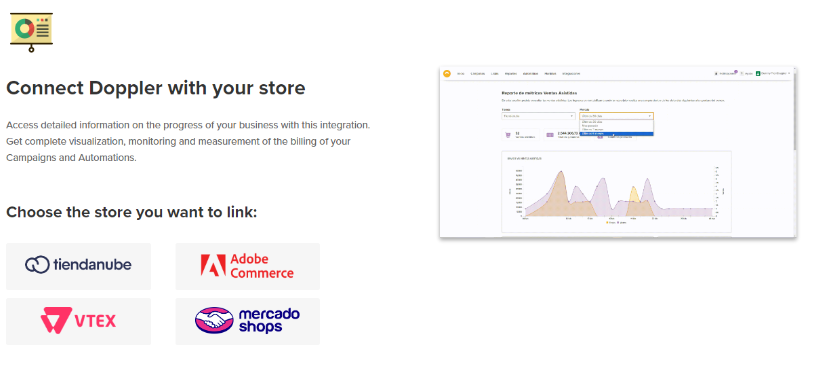
Once you log in to your Doppler account, go to the Reports section and you will find the Assisted Sales option.
To begin, if you do not have any linked integration, from this option you can integrate with any of the following stores: Tiendanube, VTEX, WooCommerce, Adobe Commerce, and Shopify.
Before understanding how to analyze your Report, it’s important to clarify that:
- An Assisted Sale is considered to be a purchase made in the submitted Campaign.
- For your purposes, it may take up to 24 hours after the purchase is made to be impacted in this Report.
Find out what you can see in this report
If you want to see, evaluate and discover how your Campaigns have been, within the “see all” option you can choose various featured options and evaluate how your Campaigns have progressed according to the period you need to observe. Let’s look at this section in detail.
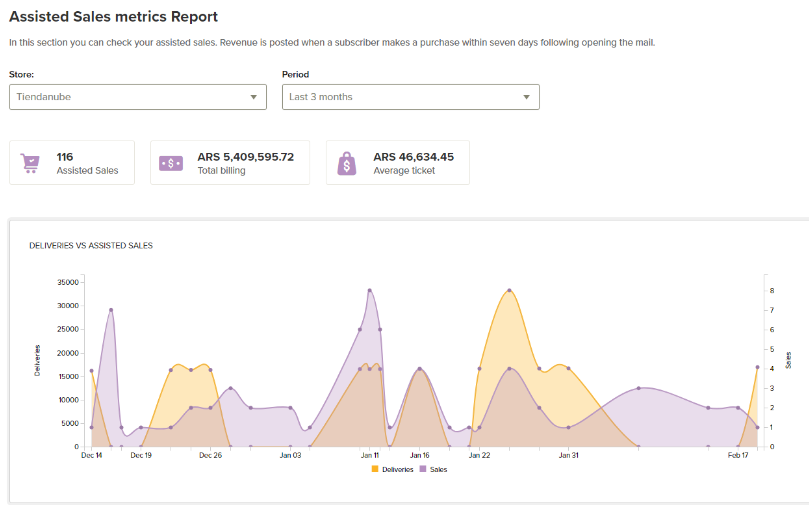
First of all, you will see an evolution graph that will show (depending on the period you select) the opening due to the assisted sales that your Campaigns obtained.
On this first screen you will also be able to see 3 large highlighted icons. The idea is that you have in a simple visualization the most important details such as:
- Number of Sales Assisted
- Total billing
- Average ticket value
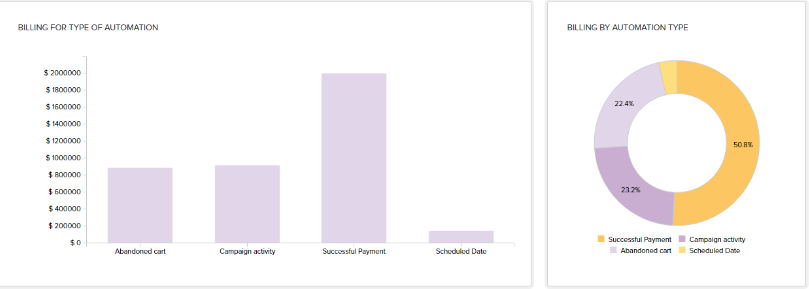
Below, you will see the information broken down in 2 ways. The idea is to make it easier to read at first glance and to obtain a practical comparison of the results of your Campaigns.
In this section you have:
- Bar chart: you will see a clear comparison between billing and the type of Automation.
- Donut graph: you will see a differentiation of billing by percentage of Automation type in a classification by color and thus easily visualize the data obtained.
In addition, you have detailed information about billing per Campaign. What would this be used for? You will be able to see a breakdown of each shipment made with data such as: total sales, total income, number of campaigns, among others.
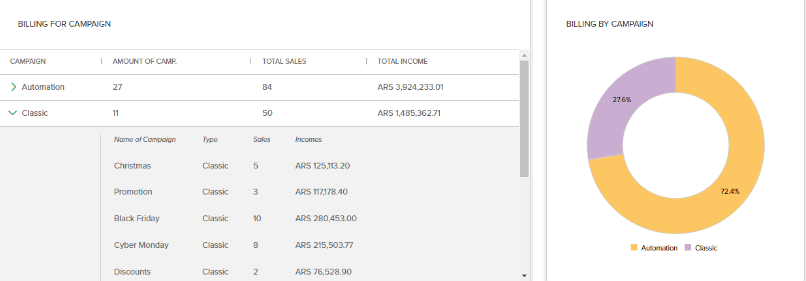
All this information will be of great help to you to know what is happening in detail in your Campaigns, and to plan your future Digital Marketing actions according to the detailed data and metrics in this report.
Many successes with your Campaigns! 🙂


Doppler informs you that the personal data that you provide to us when completing this form will be treated by Doppler LLC as responsible for this web.
Purpose: To allow you to make comments in our help center.
Legitimation: Consent of the applicant.
Recipients: Your data will be saved by Doppler and Digital Ocean as hosting company.
Additional information: In the Doppler Privacy Policy you’ll find additional information about the collection and use of your personal information by Doppler, including information on access, conservation, rectification, deletion, security, cross-border data transfers and other issues.