Discover the Email Automation Reports
Have you already implemented the best strategies to send your campaigns? It’s time to measure their results to improve your next shipments! Find out the metrics you need to keep in mind to evaluate your sendings and discuss future strategies thans to the Email Automation Reports.
Accessing Email Automation Reports
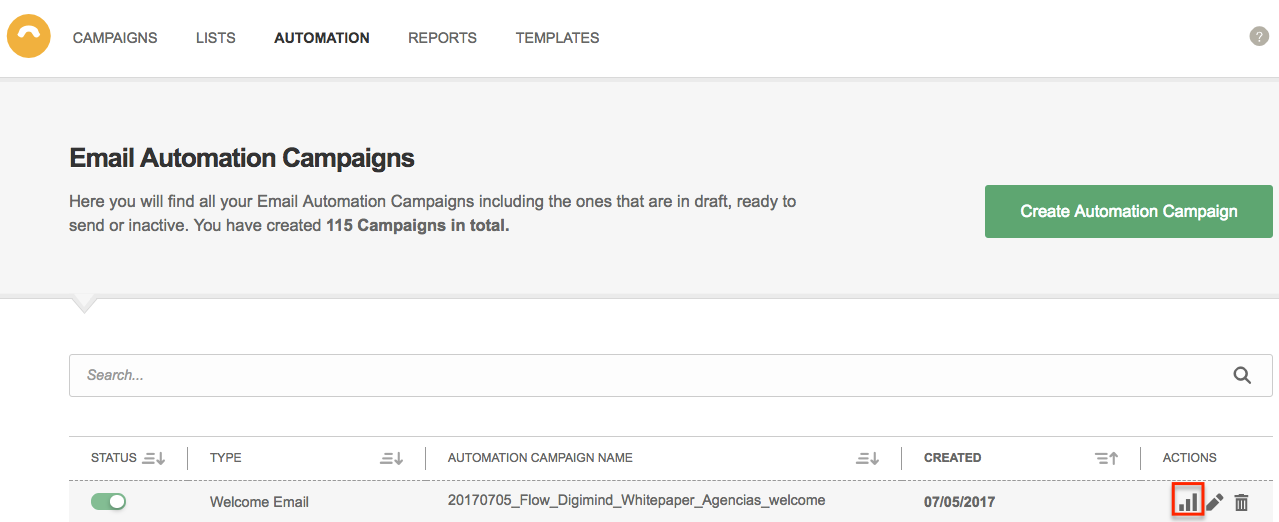
The first thing to do is log into your Doppler account and go to the Automation section.

You’ll see all the Campaigns you have created. You can use the search engine to specifically find the one you want to analyze.
Once you’ve found it, you will see on the right side three possible actions to be executed. Reports are the first one, the second one is Edit and the third one is Delete.
In this case, you will access Reports.
Let’s discover all the details of your Campaign performance!
You can either analyze the performance since last Week, last Month, last Year or the beginning of the Campaign. You can determine this through the dropdown highlighted below.
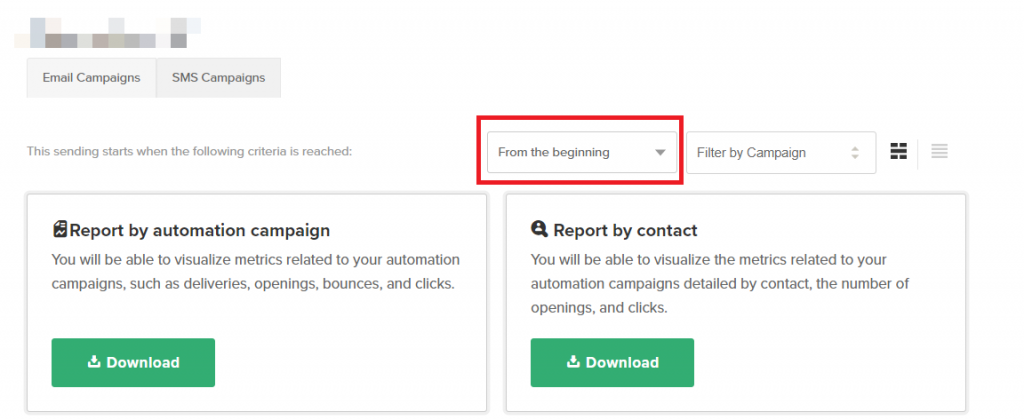
If your Campaign consists of a sequence of Emails, the results can be analyzed either individually or in groups.
In order to filter the Emails that you want to examine, go to the dropdown shown here below and select them.
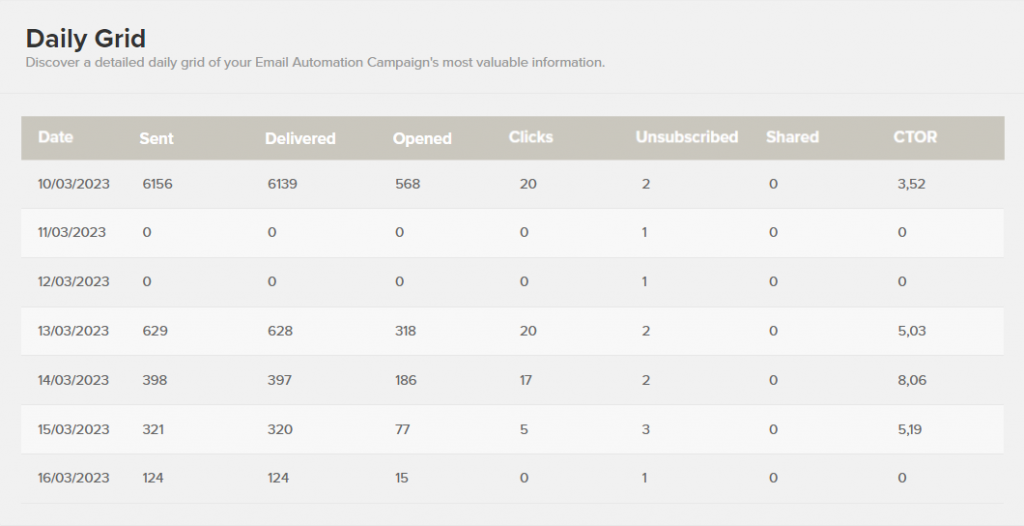
Finally, before concentrating on the metrics, you can either choose to view the results through Graphics or through a Daily Grid.
After selecting the Daily Grid icon you will see the following table:
This choice will depend, on the one hand, on the format with which you feel more comfortable. On the other, with the aim of your analysis.
The Daily Grid, for example, shows how many times your content was shared; while Graphics do not.
Likewise, if you choose the Graphics view (the icon on the left of the daily grid) you can analyze Unique Clicks, Last Opened Date, Last Clicks Date, Times Forwarded, Engagement and Conversion Funnel, among other data not provided by the other view. Choose at your convenience!
Metrics Summary
Email Automation Reports provide a full range of results that you might want to analyze to see the performance of your Campaign and to improve your next shipments. These are:
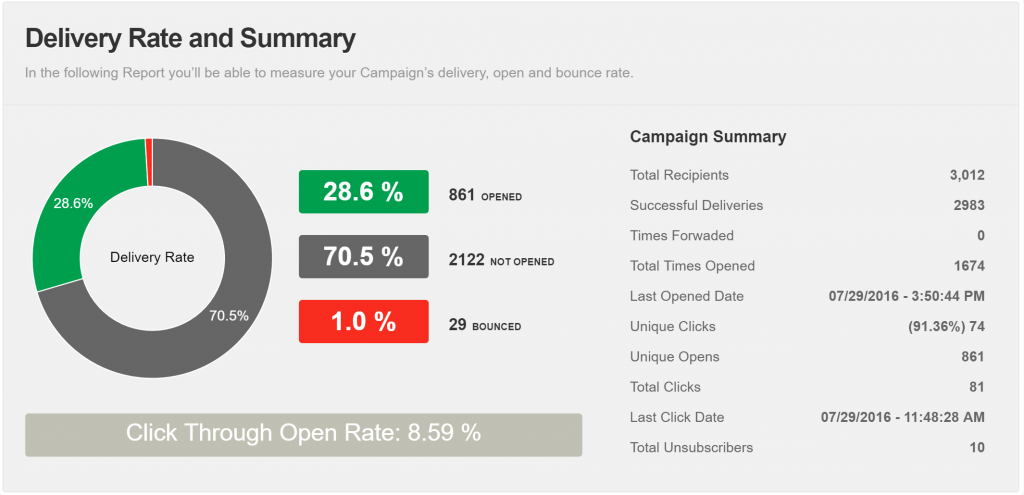
– Delivery Rate and Summary: You will see here the Delivery Rate, Openings, Bounces, Click Through Open Rate, and a summary of your Campaign data, such as Total Recipients, Successful Deliveries, Times Forwaded, Total Times Opened, Last Opened Date, Unique Clicks, Unique Opens, Total Clicks, Last Click Date and Total Unsubscribers.
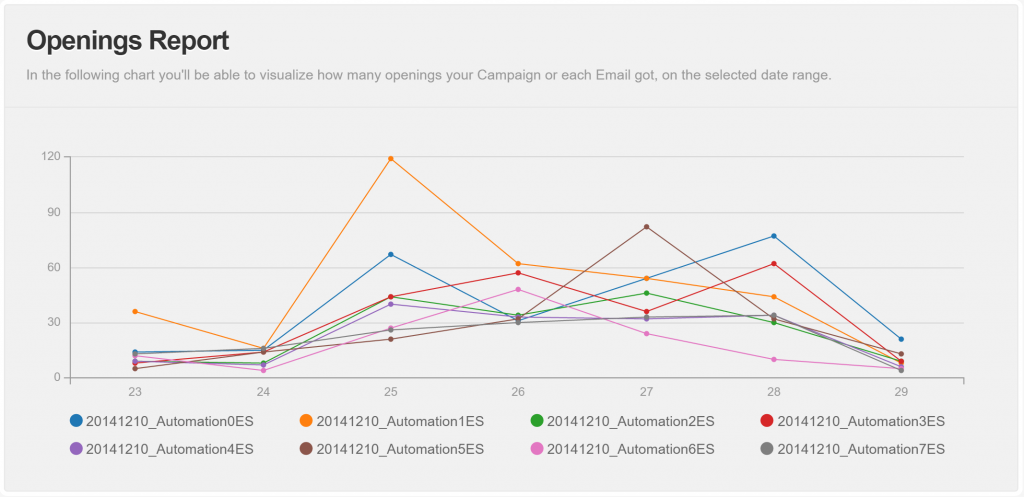
– Openings Report: In this chart you will specifically analyze the openings of each Email of your Campaign has earned in the selected period, day by day. Which is the day your Campaign worked best? Take this into account to send your Emails at the right moment!
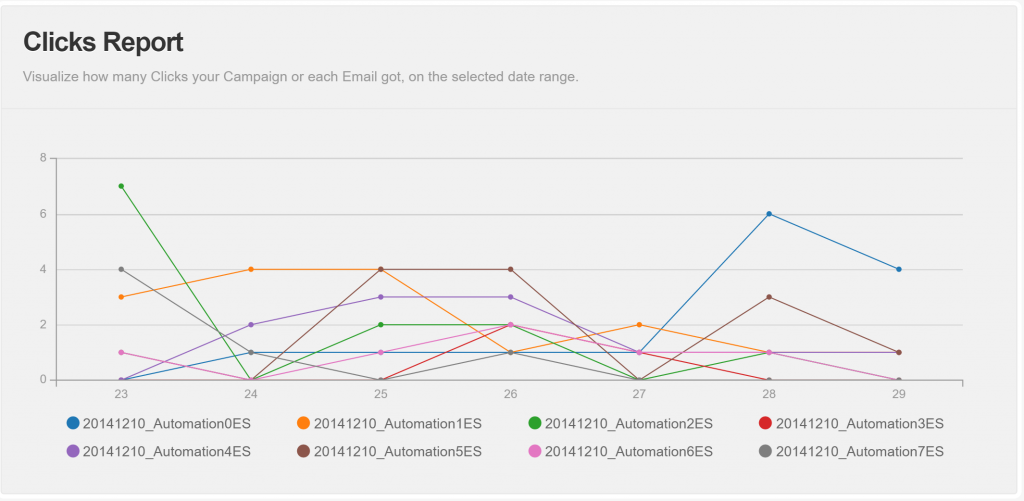
– Clicks Report: You can do the same with Clicks and you will know how interesting your content is to your Subscribers. Have they entered to the links you included in your piece? Congratulations! Then you have surely done a good work.
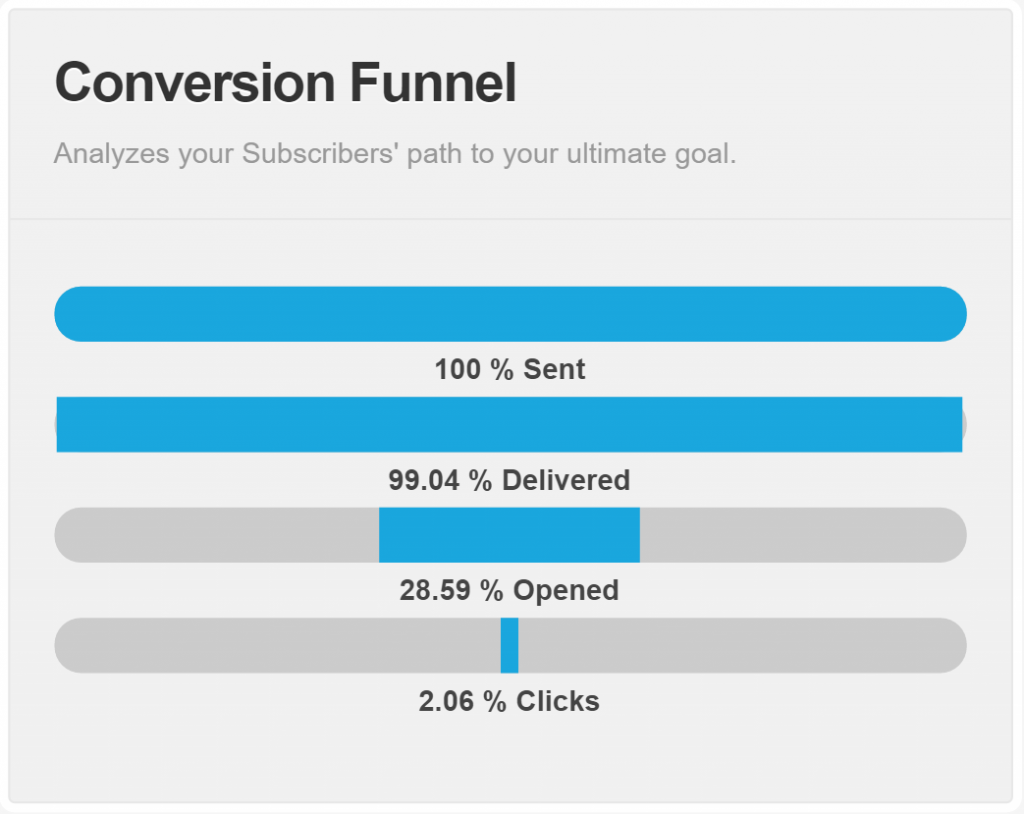
– Conversion Funnel: There are many steps a Subscriber may take before doing a conversion. Analyze their results to improve your strategy, focusing on the weakest points and taking advantage of your strengths.
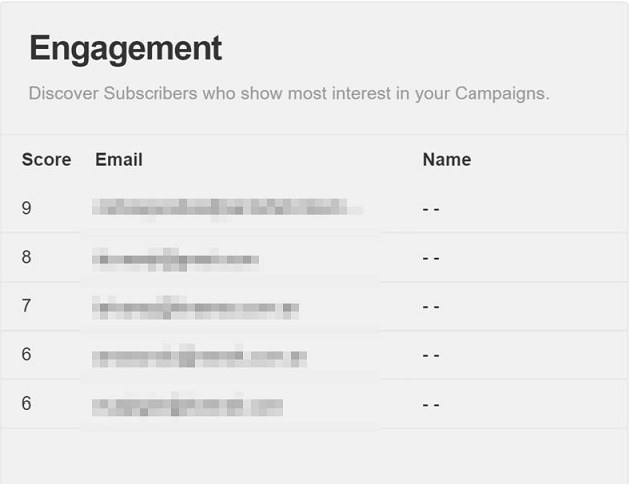
– Engagement: You are not the only one who analyzes and draws conclusions about your results. Doppler does its own too! Thanks to this, you can discover which Subscribers demonstrate greater interest in your Campaigns. Give them a special treatment!
Downloading Email Automation Reports
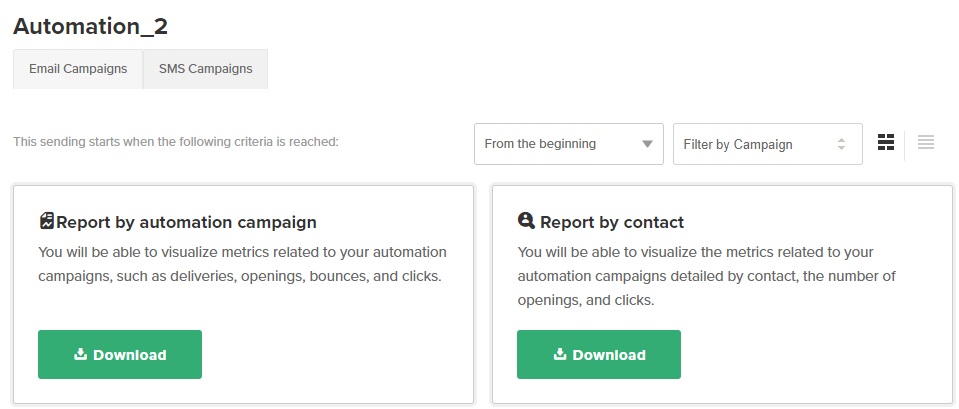
The reports of your automation campaigns are very easy to download and there are two types:
Report by automation campaign. It allows you to visualize metrics related to your automation campaigns, such as number of deliveries, opens, bounces and clicks.
Report by contact. Displays metrics related to your automation campaigns with details by contact, number of opens and clicks.
Just choose the type of report to download by selecting “Download”.
Then fill in the email address you want the report to be sent to.
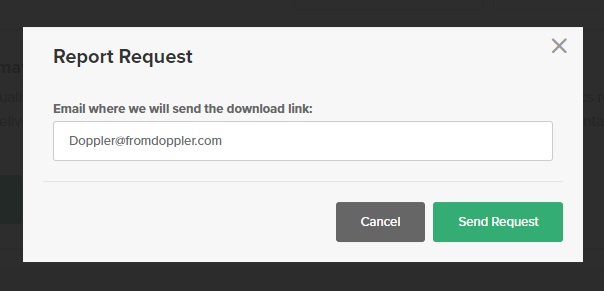
That’s it! In the download center you can view the status of the report request or wait for it to arrive to the email you entered.
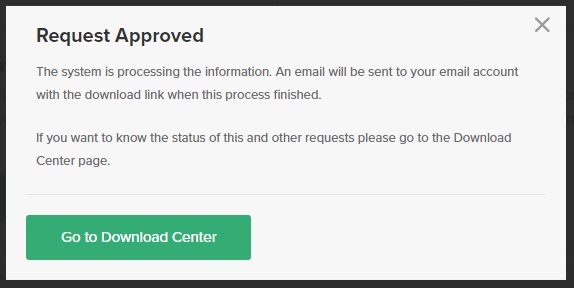
Important: the report you will receive in your email will take the filters you have applied when viewing it, either by campaign or by time.
Some tips to better understand your Reports
Which conclusions can you draw from all this information? Thousands!
Delivery Rate will reveal if your Campaign is effectively reaching the Inbox of your Subscribers. If this number is very low, maybe you should do a cleanup of your Database, as surely many Email Addresses no longer exist.
You have a good Delivery Rate but few Openings? Go check your Subjects! They may not be attractive enough.
You can also compare Openings with Unique Openings to see if your pieces attract so much your Subscribers attention, that they open them more than once.
The CTOR (Click Through Open Rate) divides the number of Subscribers who clicked on your link/s for the number of Opened Emails, and the result is multiplied by 100. This will help you know how relevant your content is to your Database and the interest it arouses. Pay attention!
You are ready now to access and evaluate all your Automation Reports.
Do you want to know more about how to analyze and get the most out of your Reports? Don’t miss all Help Center posts that explain specifically how many of these metrics work.
Use this information to take the best decisions in your next email sending!

 ES
ES EN
EN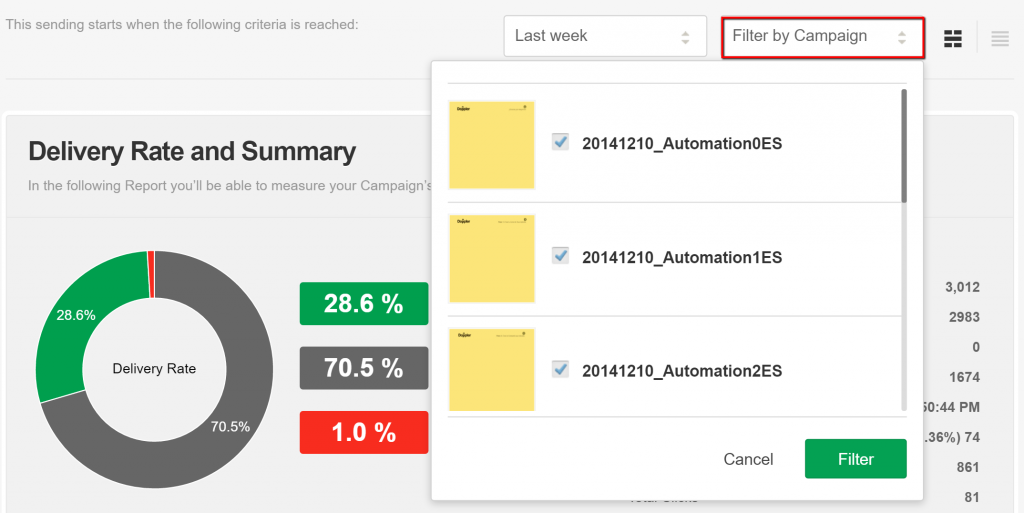



Doppler informs you that the personal data that you provide to us when completing this form will be treated by Doppler LLC as responsible for this web.
Purpose: To allow you to make comments in our help center.
Legitimation: Consent of the applicant.
Recipients: Your data will be saved by Doppler and Digital Ocean as hosting company.
Additional information: In the Doppler Privacy Policy you’ll find additional information about the collection and use of your personal information by Doppler, including information on access, conservation, rectification, deletion, security, cross-border data transfers and other issues.