 ES
ES EN
ENIntegrate BigQuery and visualize personalized reports
Thanks to this integration, information about Campaigns sent from Doppler goes to BigQuery (a Google cloud storage service). It travels from there to a Data Analytics tool to visualize personalized reports.
The main advantages of this integration are:
- The chance to obtain personalized reports about your Campaigns in a simple way.
- The data crossing, not only data about Doppler Campaigns but also information from other data sources.
- The identification of action items to optimize your Email Marketing strategy and digital strategy in general.
To complete the integration, you must take action both in Doppler Integration section and in Google Cloud.
Index:
- Give access permissions to BigQuery from Doppler
- How to create a project and highlight it in Google Cloud
- How to visualize your campaign reports in 3 data analytics tools
- Connect Looker Studio with BigQuery
- Connect Power BI with BigQuery
- Connect Tableau with BigQuery
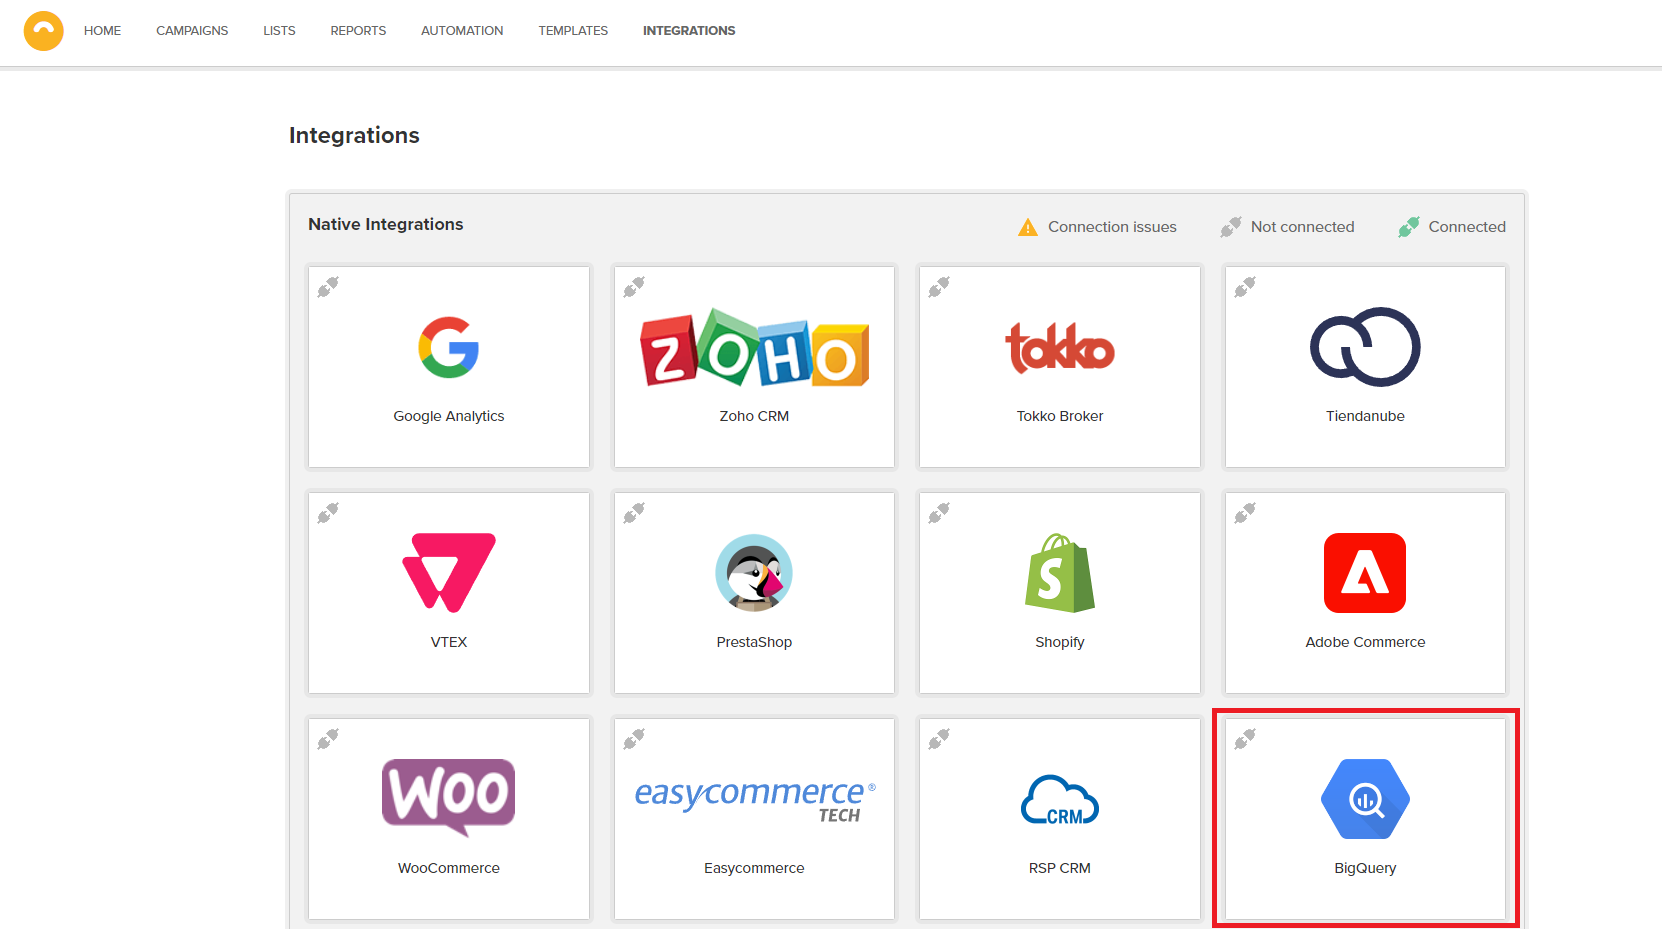
How to give access permissions to BigQuery from Doppler
1 – Login to your Doppler account. From the Integrations section you will see the BigQuery icon.
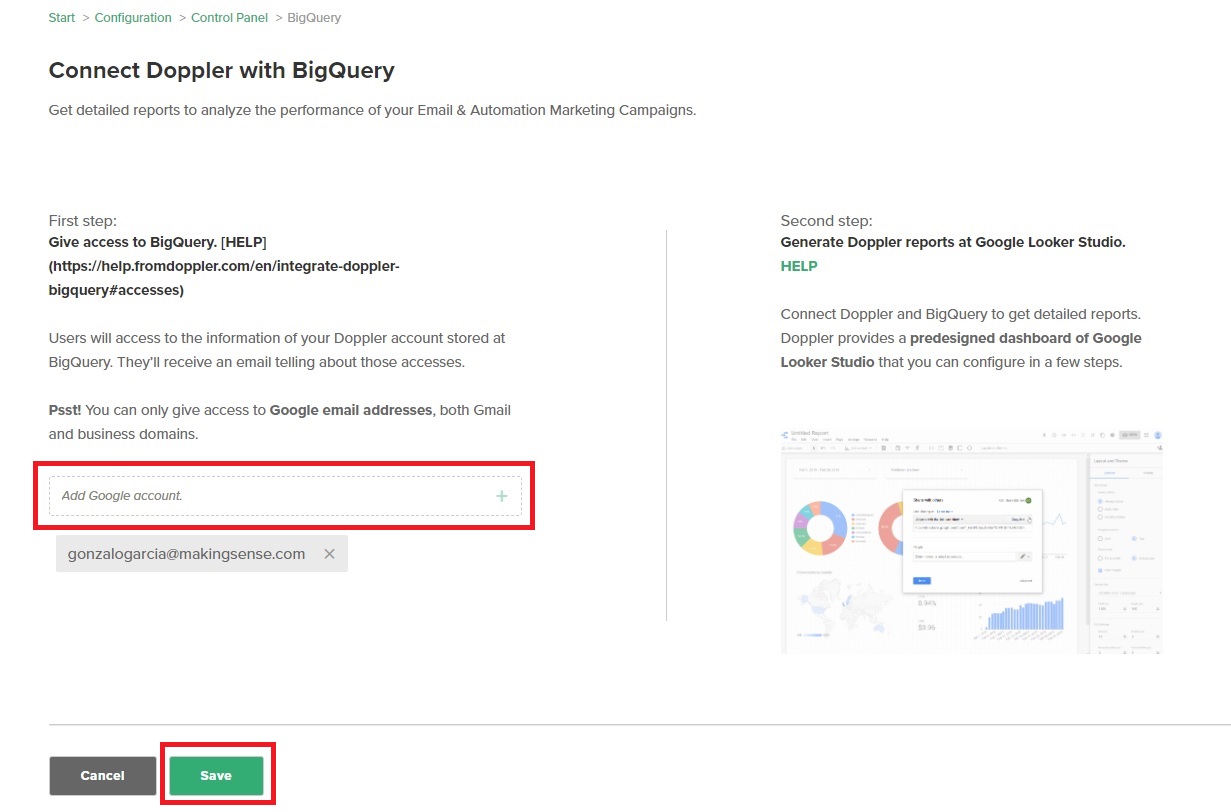
2 – By clicking there you will be able to grant access permissions to BigQuery or to any Google account, either with Gmail domain or corporate accounts. Add an email account to give permission and press “Save”.
How to create a project and highlight it in Google Cloud
1 – Enter to Google Cloud.
2 – If you are not logged in, you have to write your Google email address and password.
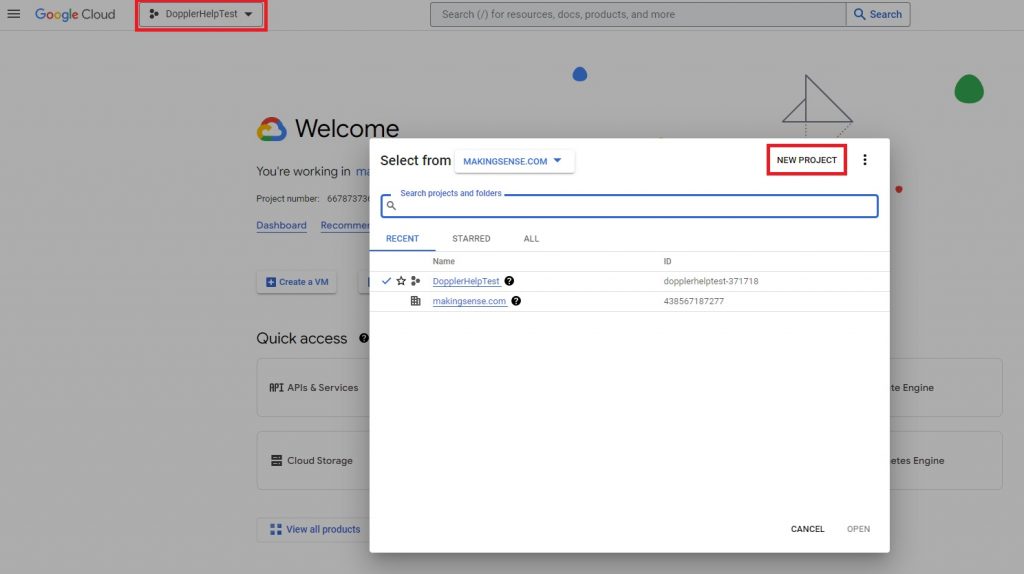
3 – Now you are in the Google Cloud dashboard! Click on the left side of the screen to create your own project and link up with Doppler’s Project. At the right of the modal, click “New project” and the “Open”.
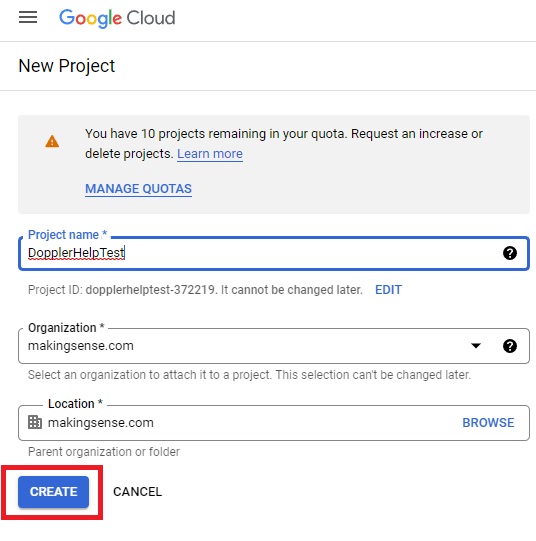
4 – Choose project’s name and configure the extra information. Then go to “Create”.
5 – Done! Your recent project will be shown on the left side of the screen.
Before going ahead, you have to configure a credit card in the Billing Information section of Google Cloud Platform. This is because Google charges every information request that exceeds the daily maximum included.
If you don’t do it, you cannot visualize information saved at BigQuery. Take a look at this Google article to configure the Billing section step by step.
6 – To link a new project with the Doppler project in BigQuery, you must first click on the “+Add” button

Then select the option: “Highlight a project by name”
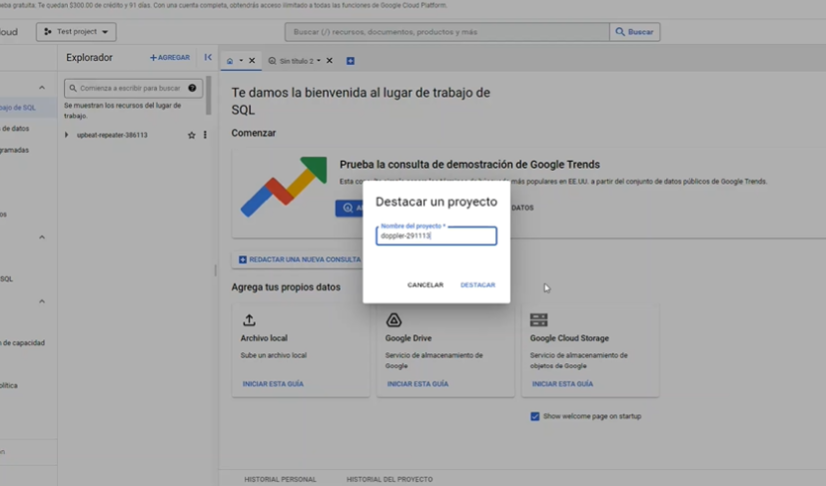
Then you will assign the specific name “doppler-291113” (since it is Doppler’s own for the integration to work correctly) and that’s it! Your new configuration will now be ready to start using.
We add as a detail, that if you already have the integration configured, you will be able to use it as you were doing.
Artículos relacionados: ¿Qué significan los Campos de la tabla Campaign Detail? y ¿Qué significan los Campos de la tabla Campaign Summary?
You’ve just completed all the steps at those platforms, and now they’re correctly matched. Information about Campaigns sent with Doppler will be automatically updated in BigQuery every one hour.
Let’s go ahead! We’ll see how to use this information to generate personalized reports at three of the most popular Data Analytics tools.
How to visualize your campaign reports in 3 data analytics tools
It’s time to get the information about your campaigns reflected in a dashboard or data visualization tool so you can take advantage of it. There are many data analytics tools that you could use for that, but we will focus on three that are among the most popular on the market and are also easy to set up: Looker Studio, Power BI and Tableau.
Connect BigQuery with Looker Studio
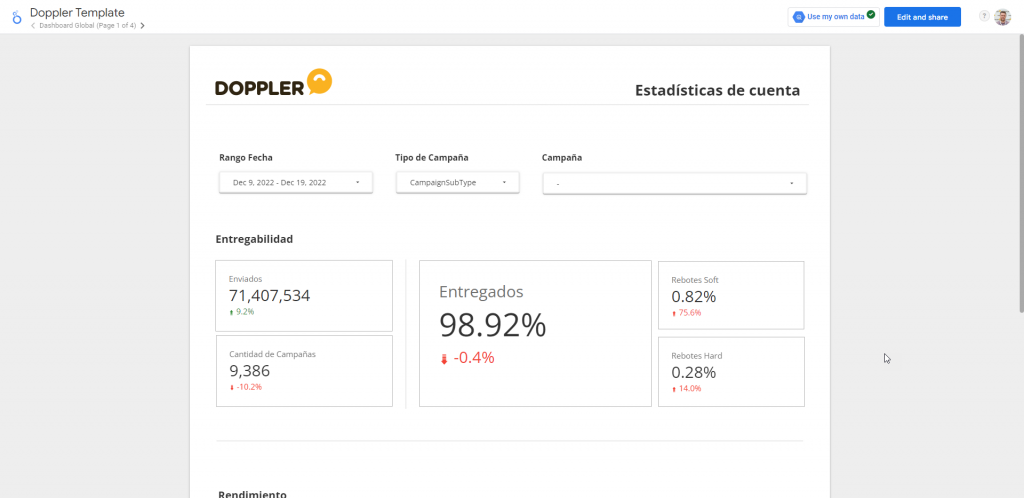
Looker Studio is a free tool from Google that uses a pre-designed dashboard with fields and metrics that will be displayed by default, and that you can edit to your liking.
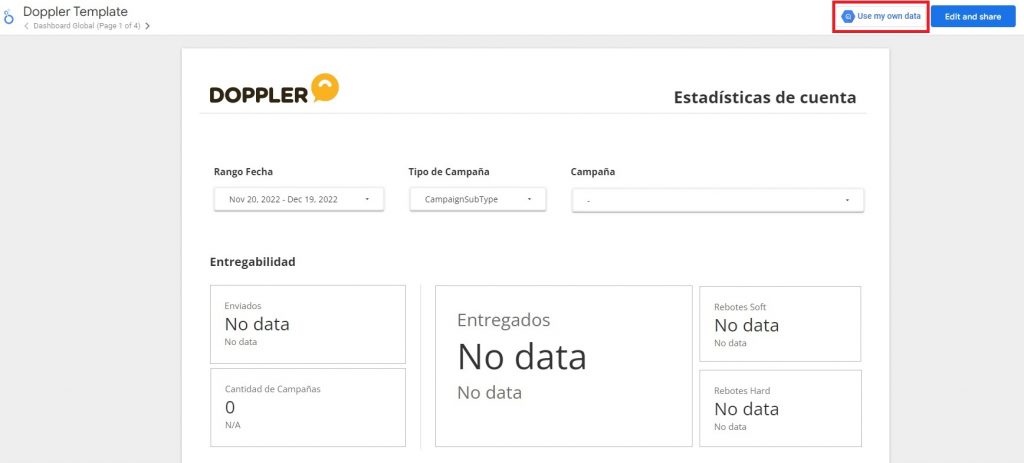
1 – Go to this link where you will find the Looker Studio dashboard template. Select “Use my own data” in the upper right margin of your screen.
2 – Choose “Shared projects” and then in “Billing project” select your project, in this case ours was named “DopplerHelpTest”.
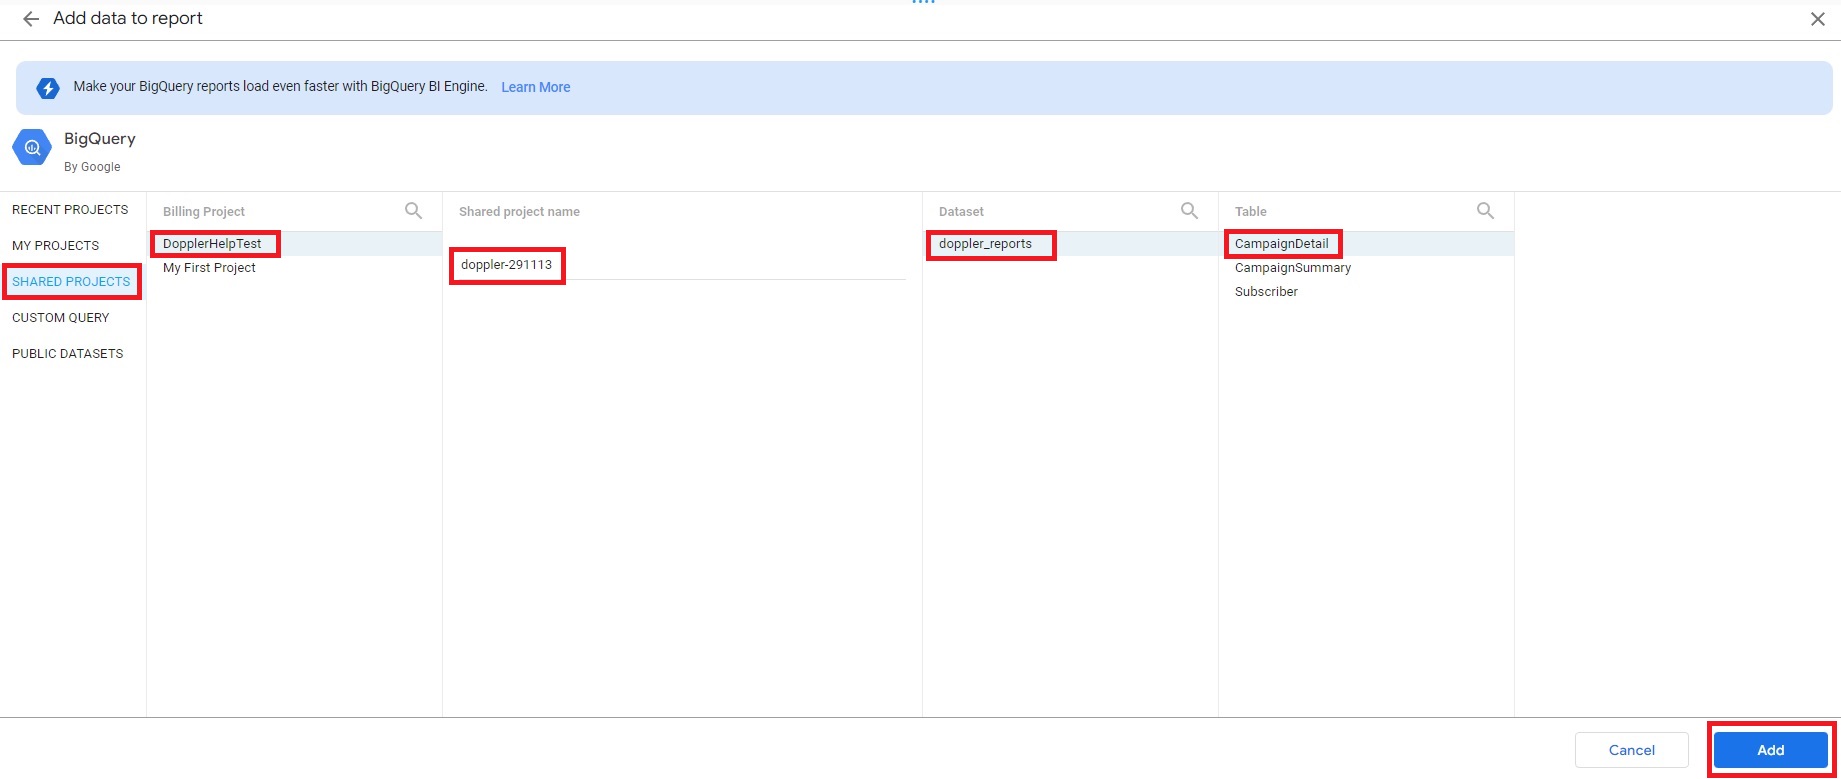
Choosing the latter will enable the “Shared project name” column and that is where you must type this text without quotes “doppler-291113” to link to Doppler.
Now you will see “doppler-reports” in the “Dataset” column, choose it and under “Table” you will have options. Find the tables you want to examine and continue with the “Add” button.
3 – Wait a few minutes to display your account information in the Looker Studio dashboard.
Watch all the process in this video.
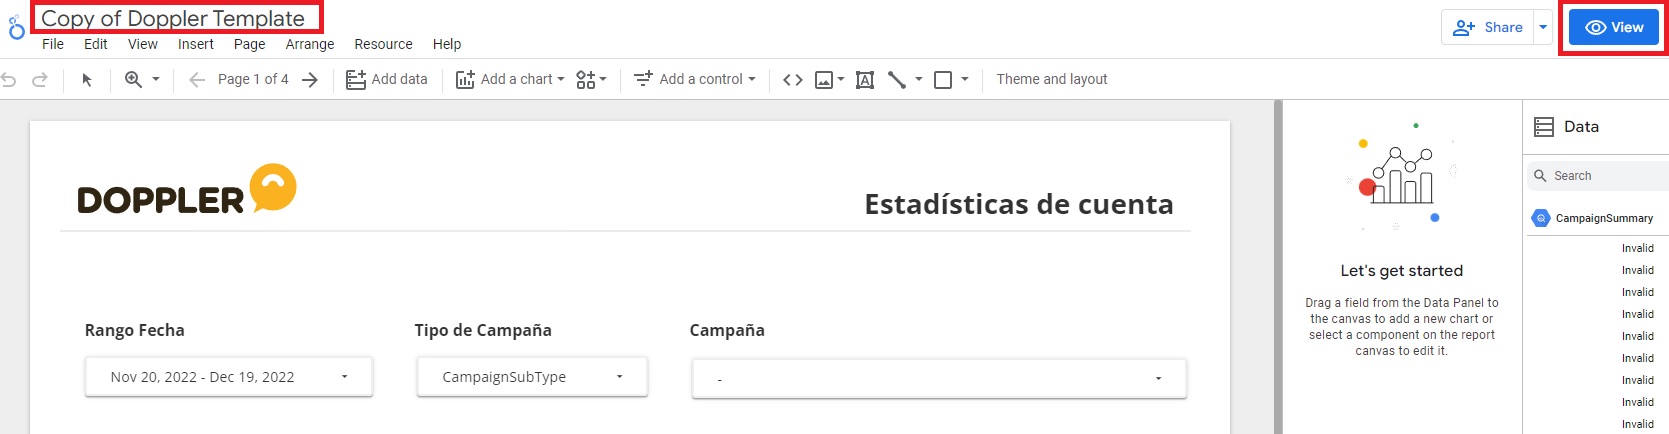
4 – Now it’s time to make a copy of your table so that the next time you want to view the report you don’t have to repeat all the steps. It’s very easy. Go to the “Edit and share” button, this will enable the edit mode.
5 – Place the cursor over the title and change it to another one. From now on it will be saved among your Looker Studio projects. Return with “View”.
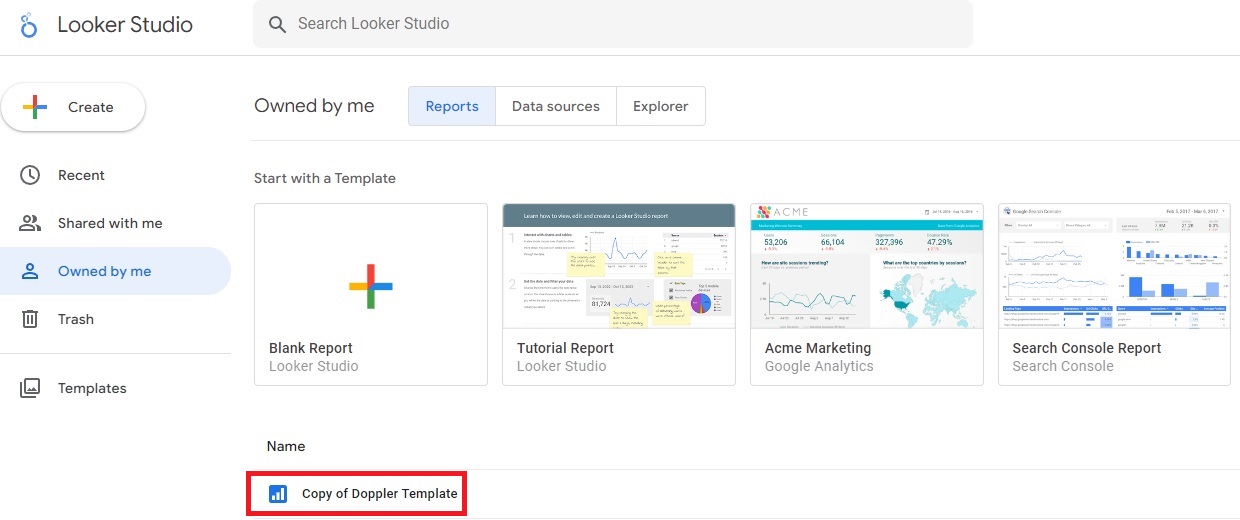
6 – You will see your new report from the main Looker Studio screen.
Connect BigQuery with Power BI
1 – To start, download and install ODBC Driver for BigQuery from this link. Choose 32 or 64 bits version.
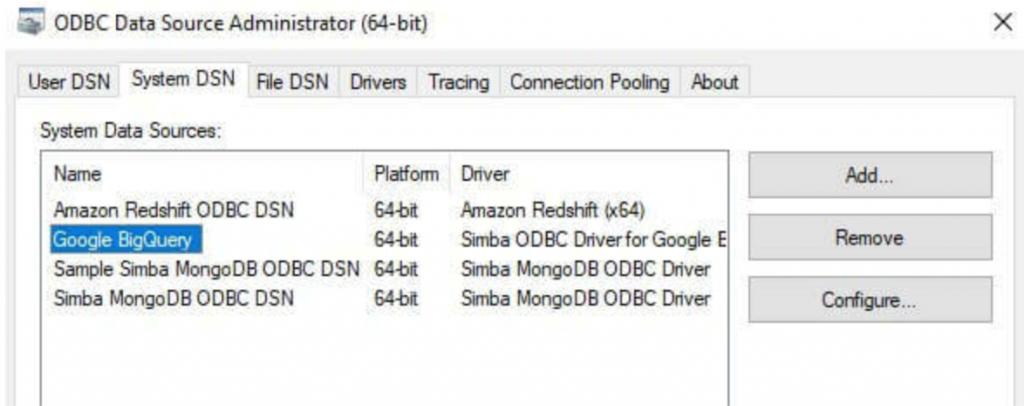
2 – Open the ODBC Data Sources admin and go to SYSTEM DSN, identify Google BigQuery option and click Configure.
3 – In the Authentication section, choose User Authentication. Then click Sign in, you’ll be redirected to the browser. Enter your Google user and password. A confirmation code will be shown: copy and paste it in ODBC admin.
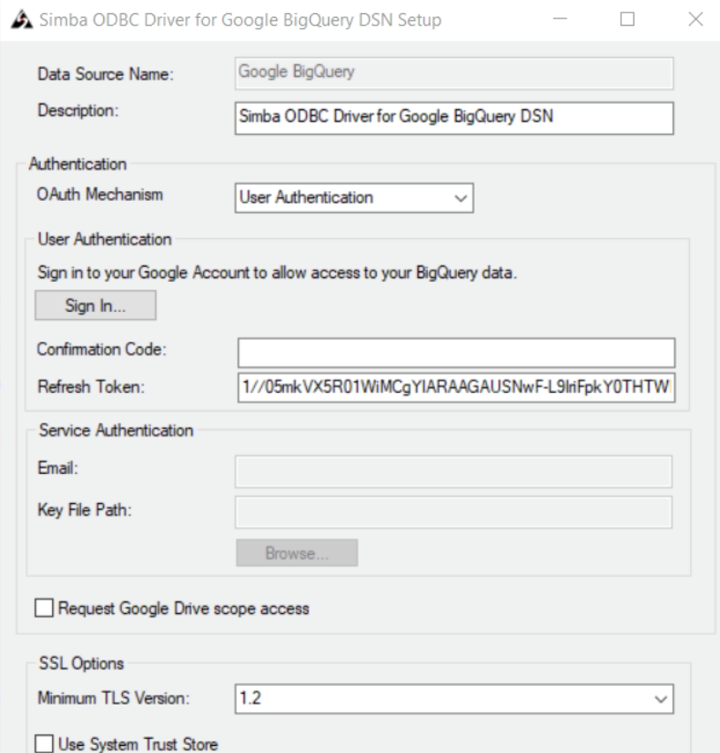
4 – Click Refresh token, so it will be autocompleted based on the code you’ve pasted in the last step.
5 – In the Catalog (Project) option, display it to see the project you’ve created in Google Cloud Platform (How to create a project and highlight it in Google Cloud). Select it and click Test to be sure that the connection is done.
You are ready to complete the process from Power BI.
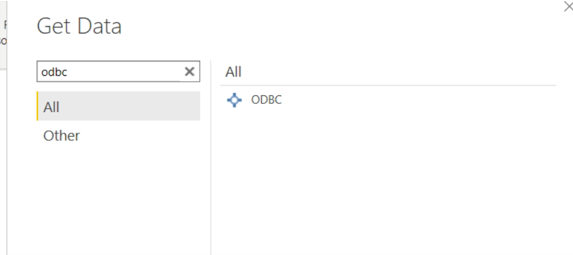
6 – Open Power BI, go to Get Data and look for ODCB.
7 – Select Google BigQuery and paste the following query at the Advanced Options section:
SELECT * FROM `doppler-291113.doppler_reports.CampaignSummary`
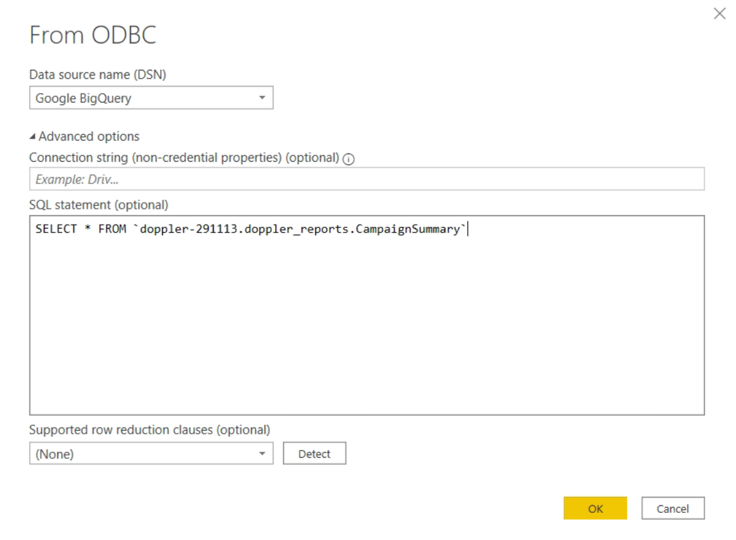
To finish, click OK. Next you’ll see your Campaign data and start designing your dashboard.
Connect BigQuery with Tableau
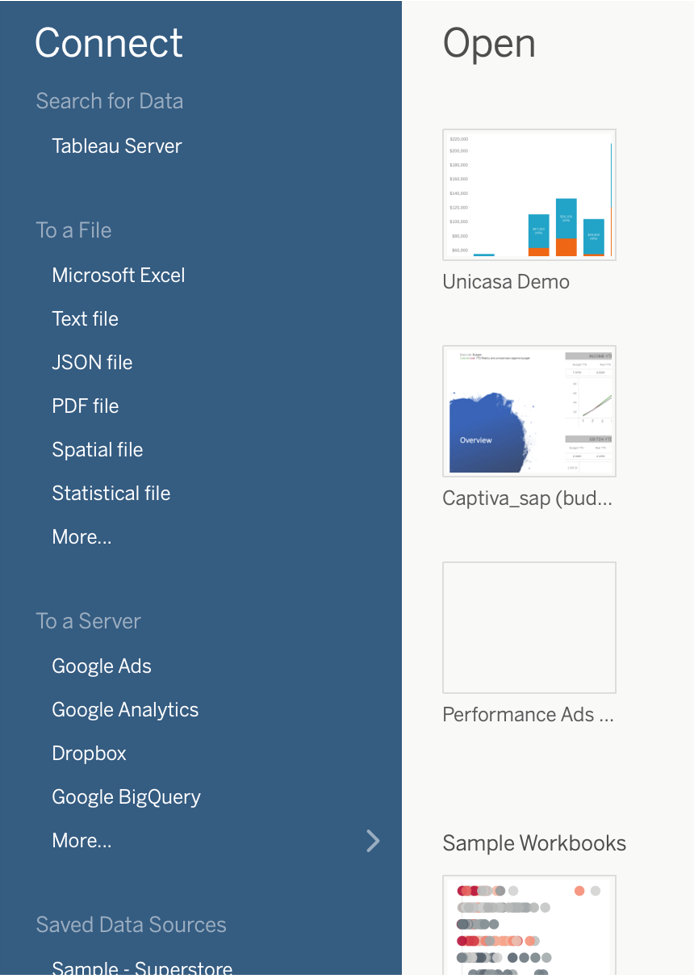
1 – Open Tableau. At the Connect section, go to To a Server and choose Google BigQuery.
2 – You’ll be redirected to log in with the Google account that has permission at BigQuery. Once you enter your Email address and click Continue, you will be able to return to Tableau if everything is OK.
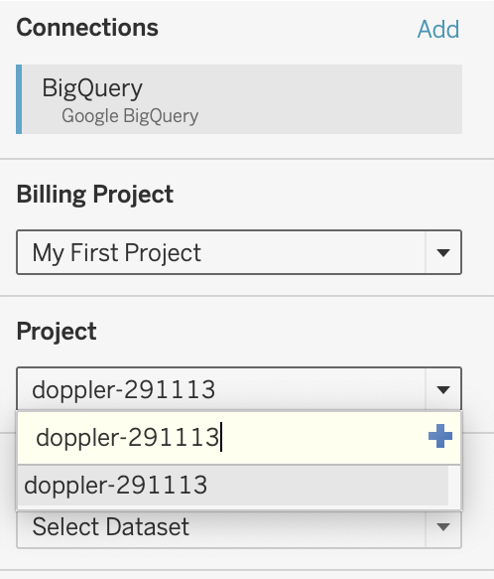
3- Choose the project you’ve created at Google Cloud Platform (How to create a project and highlight it in Google Cloud).
4- In the Project section, display and choose doppler-291113. If it doesn’t appear, click + and write its name.
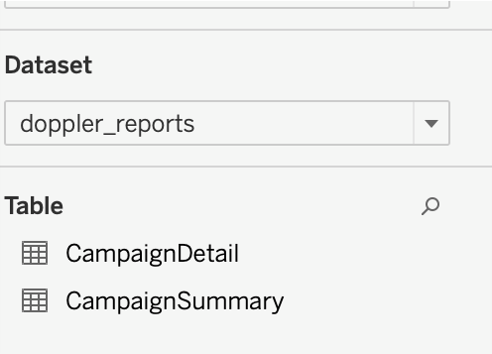
5- At the Data Set section, choose doppler-reports. To finish, drag the table you want to use to prepare your report.
That was all. Enjoy the integration!


Doppler informs you that the personal data that you provide to us when completing this form will be treated by Doppler LLC as responsible for this web.
Purpose: To allow you to make comments in our help center.
Legitimation: Consent of the applicant.
Recipients: Your data will be saved by Doppler and Digital Ocean as hosting company.
Additional information: In the Doppler Privacy Policy you’ll find additional information about the collection and use of your personal information by Doppler, including information on access, conservation, rectification, deletion, security, cross-border data transfers and other issues.